Market Commentary
Bitcoin
Every government has to have a bank account to send and receive payments. In the case of the U.S. government, their “checking account” is the Treasury General Account. You may have heard this name before - and in today’s dispatch we’ll explore why it matters to bitcoin price.
The Treasury General Account is controlled by the U.S. Treasury Secretary, Janet Yellen. You can see that, like everyone else, her balance goes up and down over time.

While the balance has gotten close to zero before - it has never actually gotten to zero. That’s because the U.S. is always able to borrow money when the checking account runs low. Here’s the U.S. Public debt chart.

As the data shows, the U.S. government has become progressively more indebted over time. Here’s the 2 charts overlaid.

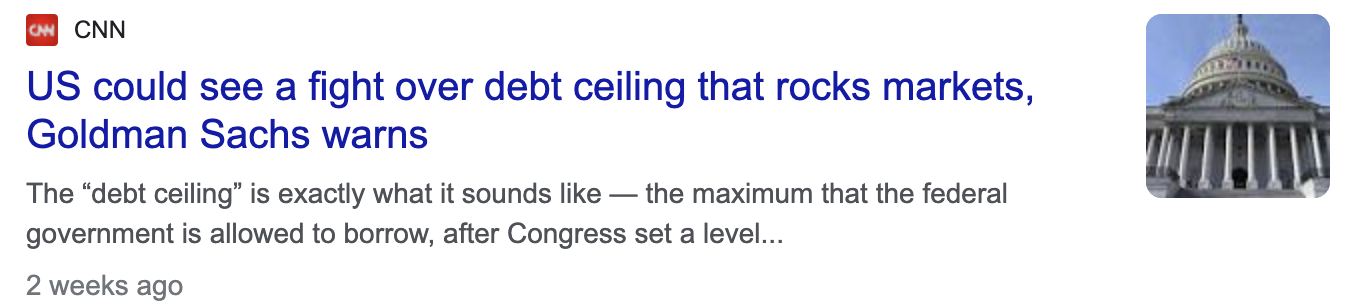
Being the responsible government that it is, the U.S. congress enforces a limit on how much debt can be taken by the government. This is the “debt ceiling” that you’ve probably heard about - and that limit currently sits at $31.4 Trillion.
For a bit of historical context, the debt ceiling was first instituted in 1917. In its 100+ year history it has been increased at least 90 times. Remember Ms. Yellen?

Even though her balance is currently sitting north of $500 Billion, she sees the writing on the wall and has been increasingly outspoken about the need to increase the limit. Current public debt is sitting at $30.9 Trillion - just 500 billion away from reaching the max, and she knows they will be tapped out soon if her limit isn’t raised again.
Why does this matter for bitcoin? For a few reasons. #1 is additional liquidity to markets, and #2 is how the political dance around raising the limit in 2023 could impact markets.
Let’s start with the liquidity aspect. As with anyone ready to spend $500 billion in any economy, Ms. Yellen’s spending is a big driver of liquidity for markets in general. When her payments hit the street, it usually boosts the U.S. economy and that liquidity finds its way to equity markets and asset prices eventually. Drawing down the Treasury General Account is generally a tailwind for markets and asset prices.
With the Federal Reserve programmatically removing liquidity from the system via rate hikes and bond sales, Ms. Yellen’s spending becomes a key driver to keep markets at bay. She’ll very likely be looking to deploy her cash within Q1 of 2023.
While this could provide some support to markets and equity prices in early 2023, her balance will eventually get deleted, which will bring us to point #2 - the political debate to increase the debt ceiling in 2023.

For further context, the Republican party has control of the U.S. congress in 2023, and the Democrats control the senate. This “divided power” sets the stage for a political battle that could take some time to resolve. Both parties will try to posture to get what they want - and their antics could spill into market volatility.
In short, TGA spending could provide some stability for markets in early 2023, but that stability could be short-lived as the debate around the debt ceiling moves to the public forum.
To close out this section, let’s go back to Ms. Yellen and explore this idea that the U.S. government can just “borrow” indefinitely when the TGA balance drops. While this is theoretically true, there are practical limitations in the real world. Nobody, the U.S. included, can borrow indefinitely without paying the price.
To understand this better, let’s use an example. Let’s say that Ms. Yellen needs a top-up. What she’ll do is request the issuance of a U.S. treasury bond (it can be in maturities ranging from 4 weeks to 30 years. This bond will then be tendered to the market to see who wants to buy it. Let’s say Ms. Yellen needs 10 Million USD. She will then offer her $10 Million bond to the market at a 1-year maturity. Because U.S. government debt doesn’t typically include an interest payment, the interest rate is determined by the cash payment on purchase relative to the notional value of the bond. For example, if people bid $9.8 Million for her $10 Million bond, the implied interest rate would be 2% (200k/9.8M) = ~2%. As people bid less for the bond, the implied interest rate increases.
Because the Federal Reserve wishes to maintain a consistent interest rate across all government bonds, it may not want interest rates to go above a certain level - i.e. they want a minimum set price paid for bonds. When the Federal Reserve sees that buyers are not showing up and bond prices are causing interest rates to spike, it intervenes. The way it intervenes is by purchasing the debt directly. Over time, this leads to Central Banks owning a larger and larger share of their own government’s debt.
The following graph shows Central Bank assets as a percentage of GDP. The image speaks for itself.
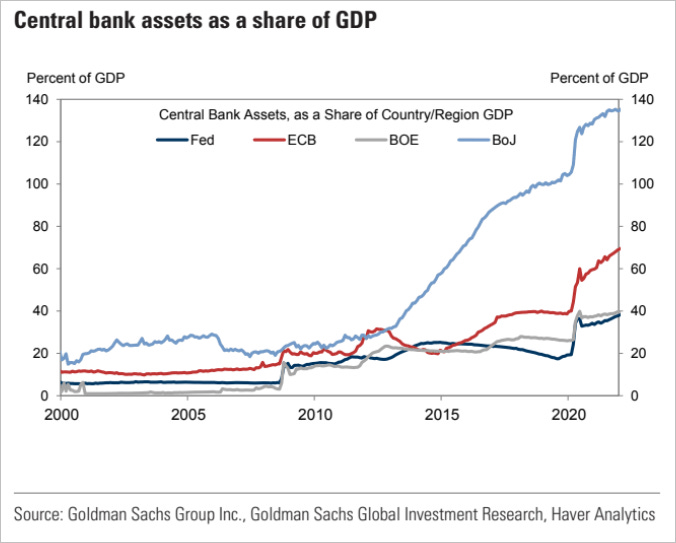
The “end-game” of this setup is best illustrated by what is happening in Japan right now.

Yesterday the Bank of Japan announced that it would let its 10-year bond interest rate move from 0.25% to 0.50% - a move that shocked markets. Why did it do this? Earlier this summer, when most central banks started raising rates, the Bank of Japan stood firm. Japan needed inflation, and by keeping rates low while others were hiking, it could accomplish just that.
In order for rates to stay low, however, people needed to buy Japanese bonds at a lower interest rate than that of the U.S. government. This led to buyers of Japanese bonds drying out. Who had to step in? You guessed it. The Bank of Japan. This is why the amount of assets that the Bank of Japan holds, relative to GDP, is higher than most. Every other central bank should see itself in the “Japanese mirror” - as it is only a matter of time before they’re in their shoes.
Bond issuance and government debt impacts all FIAT currencies. Governments have to borrow money or print the money they need to keep the lights on. This feels like a good time to say “there will only ever be 21 million bitcoin”.
S&P 500
It was a wild week of trading in the S&P 500 last week, rising by 4.3% after Tuesday’s CPI print, and dropping by more than 6% after the Fed decision and Jerome Powell’s speech on Wednesday. It closed the week down by -2% at 3,852.

Mr. Powell talked down markets and signalled that the Fed was prepared to raise rates to 5.1% over the course of 2023. Prior to the press conference, the market was expecting the terminal rate to be at 4.7%.
Beyond the terminal rate moving higher, the market is at odds with the Fed in one more area. As you can see from the chart below, investors expect the Fed to begin cutting rates sometime in 2023.

But, interestingly - the Fed’s meeting notes from last week reveal that the Fed is not planning to cut rates at any point in 2023.

In other words, the market thinks the Fed is bluffing. We’ll see if the data over the next few months causes the Fed dots to move lower sooner. In the meantime, the already high interest rates will continue doing its thing - and soon we’ll start reading negative headlines in all sorts of economic pockets, particularly those who involve a heavy dose of financing, like vehicle sales and real estate.
As we mentioned in the Bitcoin section, there’s still $500 Billion to be spent from the Treasury General Account in Q1, but the damage from high rates will continue taking its toll on markets and asset prices in general.
Gold
The momentum for gold continues to pick up, and the price action reflects it. It held its ground well last week, dropping by just 0.25%, and it's currently trading higher by 1.34% for this week.
In addition to Central Banks, which have made headlines with their recent purchases, Australia’s $130 Billion Wealth Fund also took a position in gold.

Another interesting chart published by Tavi Costa, shows how Central Banks have been gradually holding more gold as a percentage of their total reserves over the last few years.

As we mentioned, gold prices are inversely correlated with real interest rates. This means that when investors can get 5% on U.S. government bonds, this draws liquidity from safe haven investments like gold - which does not earn interest. These high interest rates too shall pass, and this is when gold will shine. Expect to see more investors try to anticipate this during 2023.
DeFi
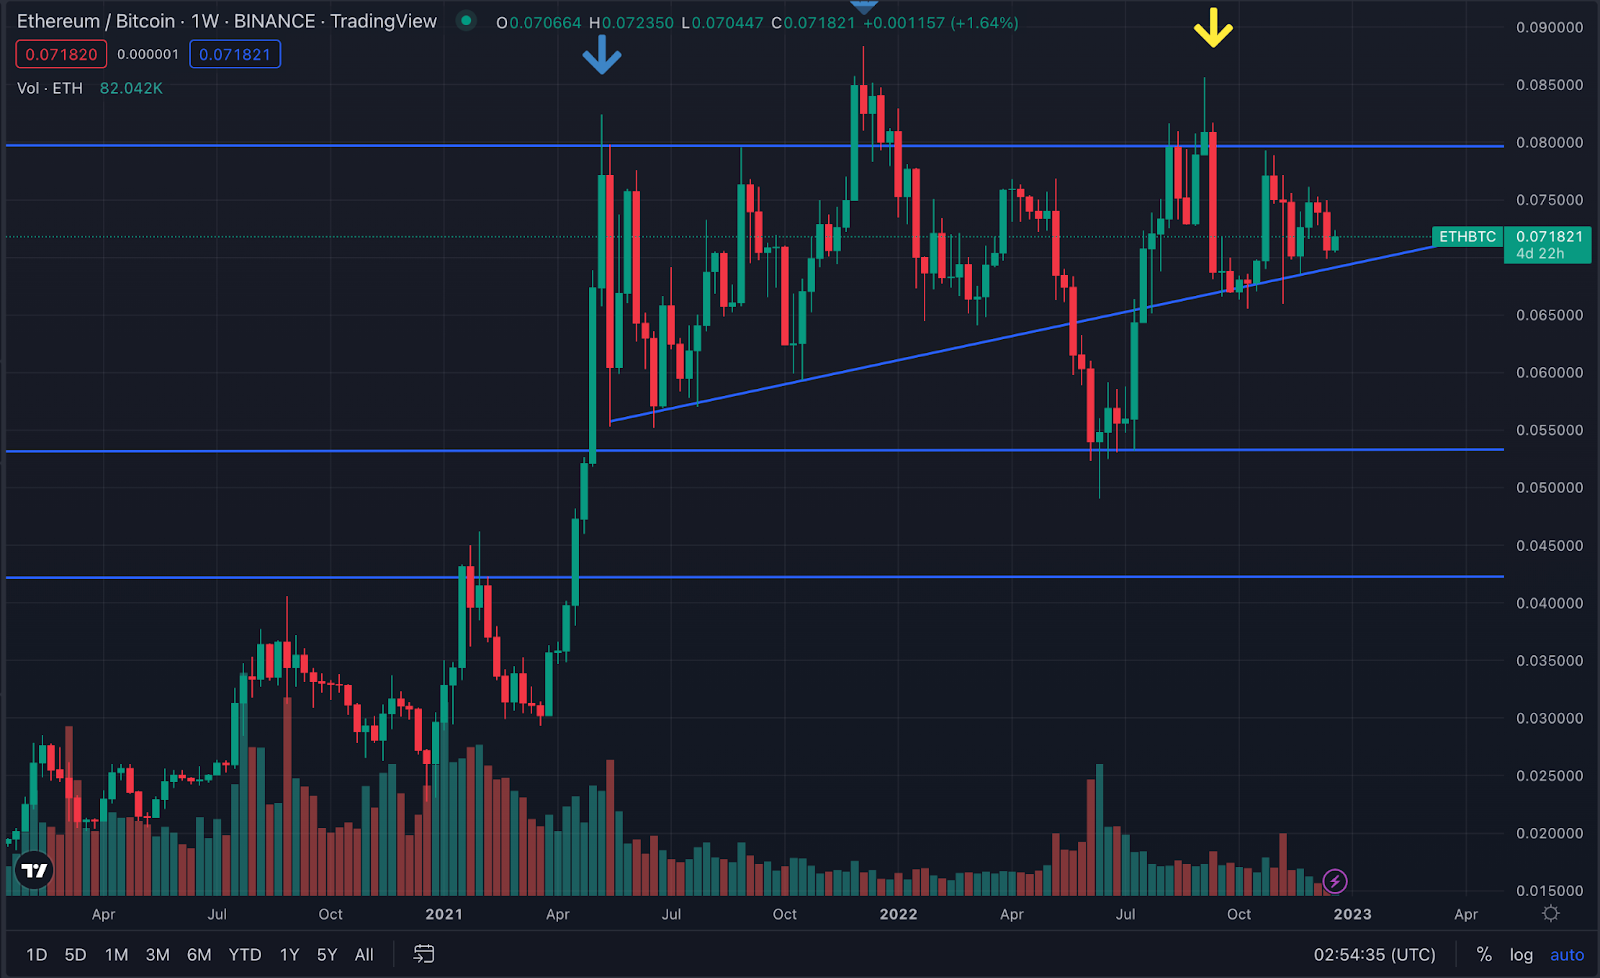
Ethereum price dropped by more than 6% last week, which made Ethereum drop by over 4% in bitcoin terms. Having said that, the trend is still clear - Ethereum in Bitcoin terms has been rising gradually.
There was also a big win for technology and human rights in the stablecoin world this week.

Last week the United Nations Refugee Agency announced its plans to use USDC to send humanitarian aid to displaced Ukranians so that they can turn it into local currency. This is not the first time USDC has been used to send aid, last year Circle teamed with the U.S. government and the Government of Venezuela to send aid to Venezuelans using USDC. We believe that this is a trend that will continue and that, increasingly, the recipients of USDC will have less of a need to turn it into local currency - as they’ll prefer to stay in USDC, opt into a service like Ledn, where they can earn interest, and eventually transact with it directly.
Difficulty Commentary
Not much has changed in the mining front this week. The last bitcoin mining difficulty adjustment of the year, which kicked in last night, brought difficulty higher by 3%. Mining conditions are still extremely negative for miners - so keep an eye out for headlines of consolidation and capitulation in this industry.
The Week Ahead
The week before Christmas will be relatively light in terms of data, with no Fed speeches and little economic data points that are relevant to Bitcoin. We will get another read at U.S. inflation through the Personal Consumption Expenditures index, which the Fed follows closely, and data on U.S. GDP.
On the PCE data, the expectation is for a 0.1% month-over-month increase relative to October’s 0.3%. Annual PCE inflation is expected to come in at 4.7% vs. last month’s 5%. Look for markets to cheer if the actuals come in below the estimates, and vice versa.
The GDP revision should show that the U.S. economy is growing at an annual rate of 2.9%. For context, in 2021, annual real GDP growth rate for 2021 was 5.7%. Look for markets to cheer a number above 2.9% and come under pressure if the data comes in lower.
Elsewhere, updates from the Genesis Capital and/or FTX situation could always move markets. On the Genesis side, the group is still trying to avoid bankruptcy and exploring options - this is likely to be the biggest wildcard for crypto markets in the near term.
As always, here’s a summary of the events and data that could move markets in the week ahead:
Thursday
08.30 AM EST - Real GDP revision for Q3 2022. Expectation is for real GDP growth rate to come in at 2.9%.
Friday
08.30 AM EST - November Core Personal Consumption Expenditures Index (inflation). Expectation is for a 0.1% month-over-month increase relative to October’s 0.3%. Annual PCE inflation is expected to come in at 4.7% vs. last month’s 5%. Look for markets to cheer if the actuals come in below the estimates, and vice versa.
It's a big week coming up, and as always, we'll keep you posted on any relevant news throughout the week right here and from our Twitter account.
Notice for U.S. Residents: Effective April 4, 2022, U.S. clients will no longer be able to earn interest on any newly deposited funds in their BTC and/or USDC Savings Accounts, where available; however, they will continue to earn interest on their pre-existing balances in their BTC and/or USDC Legacy Savings Accounts.
This article is intended for general information, educational and discussion purposes only, it is not an offer, inducement or solicitation of any kind, and is not to be relied upon as constituting legal, financial, investment, tax or other professional advice. This article is not directed to, and the information contained herein is not intended for distribution to, or use by, any person or entity in any jurisdiction or country where such distribution, publication, availability or use would be contrary to law or regulation or prohibited by any reason whatsoever or that would subject Ledn and/or its affiliates to any registration or licensing requirement. This article is expressly not for distribution or dissemination in, and no Ledn product or service is being marketed or offered to residents of, the European Union, the United Kingdom, the United States of America or any jurisdiction in Canada, and such product or service may only be marketed or offered in such jurisdictions pursuant to applicable laws or reliance on regulatory exemptions. A professional advisor should be consulted regarding your specific situation. Digital assets are highly volatile and risky, are not legal tender, and are not backed by the government. The information contained in this publication has been obtained from sources that we believe to be reliable, however we do not represent or warrant that such information is accurate or complete. Past performance and forecasts are not a reliable indicator of future performance. Any opinions or estimates expressed herein are subject to change without notice. This article may contain views or opinions of the author that do not necessarily reflect the opinions, standards or policies of Ledn. We expressly disclaim all liability and all warranties of accuracy, completeness, merchantability or fitness for a particular purpose with respect to this article/communication. Read our Disclaimers at https://ledn.io/legal/disclaimers