Ledn Blog
The Bitcoin Economic Calendar - Week of April 5th 2021
Looking at Bitcoin's Buy/Sell Volume Indicator. VIX reaches lowest point since Feb. 2020 - implications. CME to launch BTC Micro-futures.
Not yet a Ledn client? Start earning 12.50% APY on your USDC and 6.10% APY on your first 2 Bitcoin - click here to open your Ledn account!
Follow us on social media:
The Bitcoin Economic Calendar:
Week of Monday April 5th to Sunday April 11th.
Market Commentary:
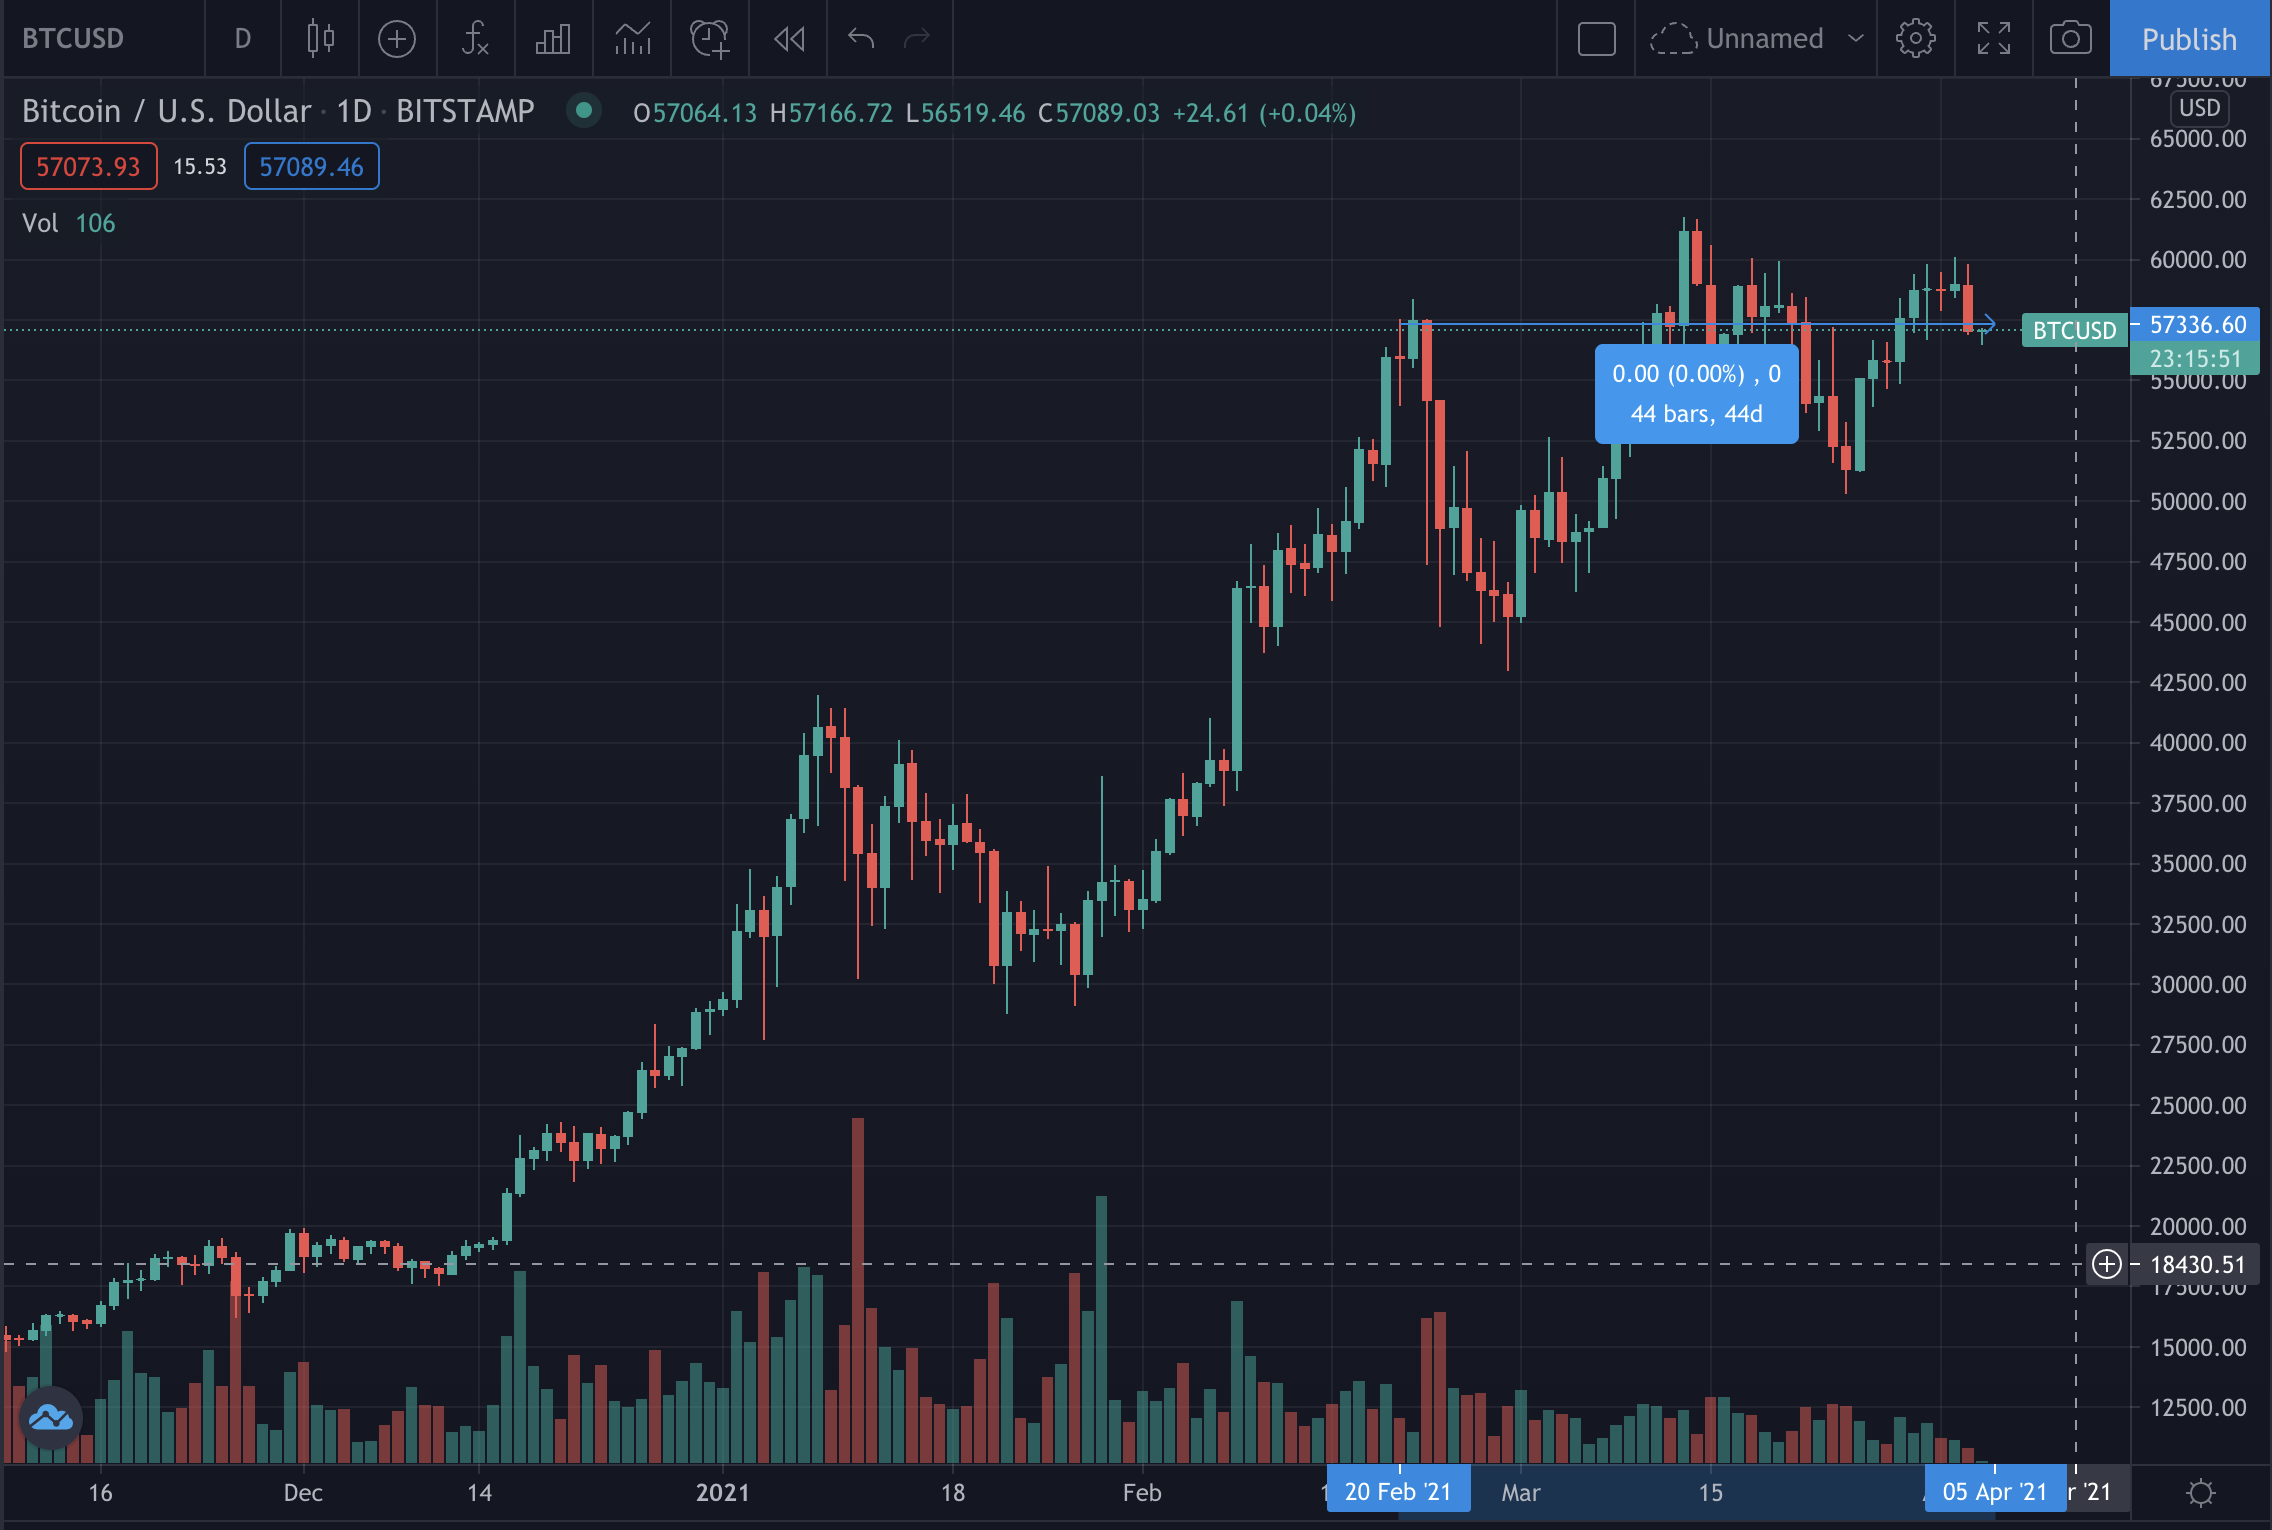
Bitcoin: After flirting with a breakout on Friday, Bitcoin closed Sunday at $58,121 - up +4.34% for the week. While price has been volatile as of late - if you zoom out, you can see that bitcoin's exactly where it was 44 days ago.
The news flow in the background has been positive. Last week Coinbase announced it got the green light to start trading on the Nasdaq on April 14th, and PayPal announced that it will allow its clients to start paying with Bitcoin and other cryptocurrencies.

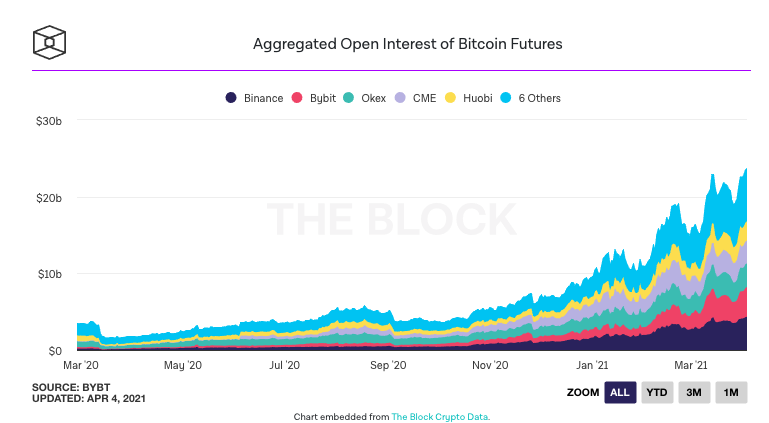
Additionally, the CME announced it will launch Bitcoin "Micro Futures" in May. Until now, the contract size for CME Bitcoin futures was 5 Bitcoin - that's close to $300k/contract, which makes them very expensive and hard to trade. The new contracts will be 1/10th of the size, so 0.5 BTC equivalent - making them much more accessible at ~$30k/contract. For context, the traded volume in Bitcoin futures has grown by approximately 10X over the last 12 months.
Additionally, Tether, the world's largest stablecoin by market capitalization, announced that it had completed its first attestation which found that they had $35.28 B of assets backing $35.15 B of Tether.

In previous market cycles, these headlines would have taken the spotlight. Currently, they are competing for attention with mainstream names like Chipotle, Paris Hilton, and even the TeleTubbies, who were all tweeting about Bitcoin last week. The fact that celebrity endorsements aren't generating the same buzz as before could be a symptom of just how much Bitcoin has penetrated the mainstream narrative already.
On the Bitcoin options front, we see a large block of open interest (~5,000 contracts) for calls in the $80k strike, and we are also seeing two relatively meaningful blocks (4,000 contracts each), for puts in the $50k strike and $40k strike. Perpetual swap funding rates are currently below their 30-day moving averages, which typically is a healthy sign going into the week.
S&P 500: The S&P 500 soared to a new all-time high of 4,038 points, leading major indexes higher, and up +1.61% for the week. The Nasdaq and Dow Jones also made new all-time highs of their own, up +0.09% and +0.24% respectively. The yield on the 10-year note went as high as 1.77% intra-week but settled at 1.68%. And the U.S. dollar had a flat week at +0.02%.

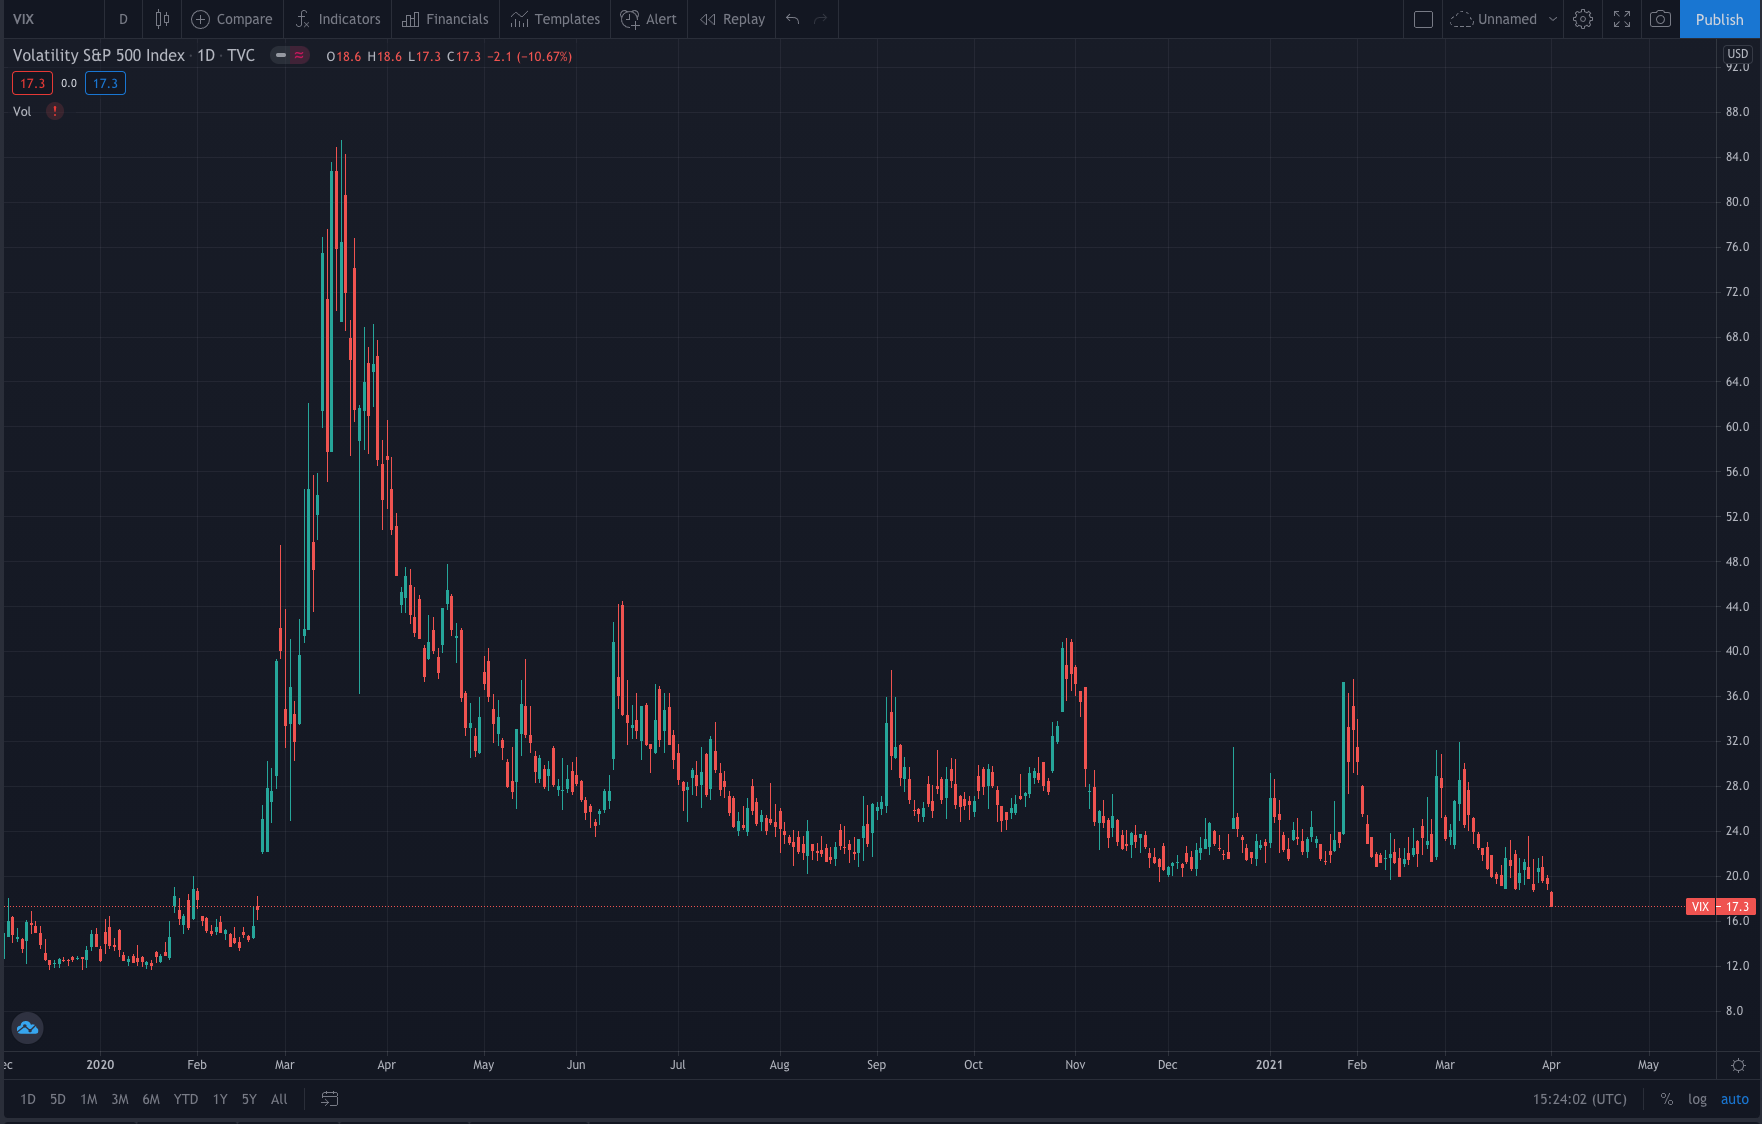
Fund manager Tom Lee highlighted during an interview with CNBC that the indicators that they follow, namely the Russell 2000 index, is close to breaking out from key levels. The Russell 2000 index tracks small capitalization stocks, with the average valuation of a stock in the index being $3.8 B. This shows just how broad the rally is, well beyond "trendy", industrials, and commodities. Mr. Lee is looking at a level of 2,293 on the index, which is currently at 2,253. In his view, breaking out above these levels could cause a continuation of a "face-ripper rally" and a substantial drop on the VIX - the index tracking the implied volatility on S&P500 options contracts, which just "closed the gap" that it opened last March.
Gold: After flirting with a new low intra-week, gold came back roaring at the end of the week to close barely higher at 1,734/oz, +0.23% for the week. There was a fascinating chart published by Frank Chaparro at The Block, comparing the institutional inflows to Bitcoin funds vs. Gold funds. Gold is on the right Y axis of the chat below.

Institutional investors have been selling gold funds and buying Bitcoin funds - we've been writing about this trend at length. We will continue to monitor how this relationship evolves - as we have mentioned, gold is a ~USD $9 Trillion market, and Bitcoin just crossed the $1.07T mark. The long-term implications of this trend cannot be understated. A ~12% rebalancing from gold to Bitcoin would double Bitcoin's current market capitalization.
DeFi: Strong week for the DeFi index, capping its highest weekly close ever, up 22.5%. Ethereum also broke above $2,000 and closed the week at a new all time high of $2075, up 23%. We have covered that the proposed law out of the U.S. to regulate digital asset transactions would likely affect DeFi the most, however, price action seems to show that investors are not too concerned. We will continue to monitor any developments on this front closely.

Another interesting signal in the DeFi space this week was that Tobi Lutke, CEO of Shopify, tweeted that he was getting into DeFi and asking his followers "what role they wanted Shopify to play" in commerce-related opportunities. This, alongside Visa's plans to accept USDC as payment, continues the trend of companies looking at opportunities in DeFi. Compatible Stablecoin payments on the world's largest credit card network and payments on one of the largest online retail platforms in the world would certainly be game-changers.
Difficulty Commentary: Big moves on the difficulty front since we last checked in. Last Thursday's difficulty adjustment brought us to a new all time high of 23.14TH, up 5.82% since the last epoch. Since then, hashrate has continued pouring into the network, with the next adjustment currently showing another 5% increase tentatively scheduled to come 10 days from now.
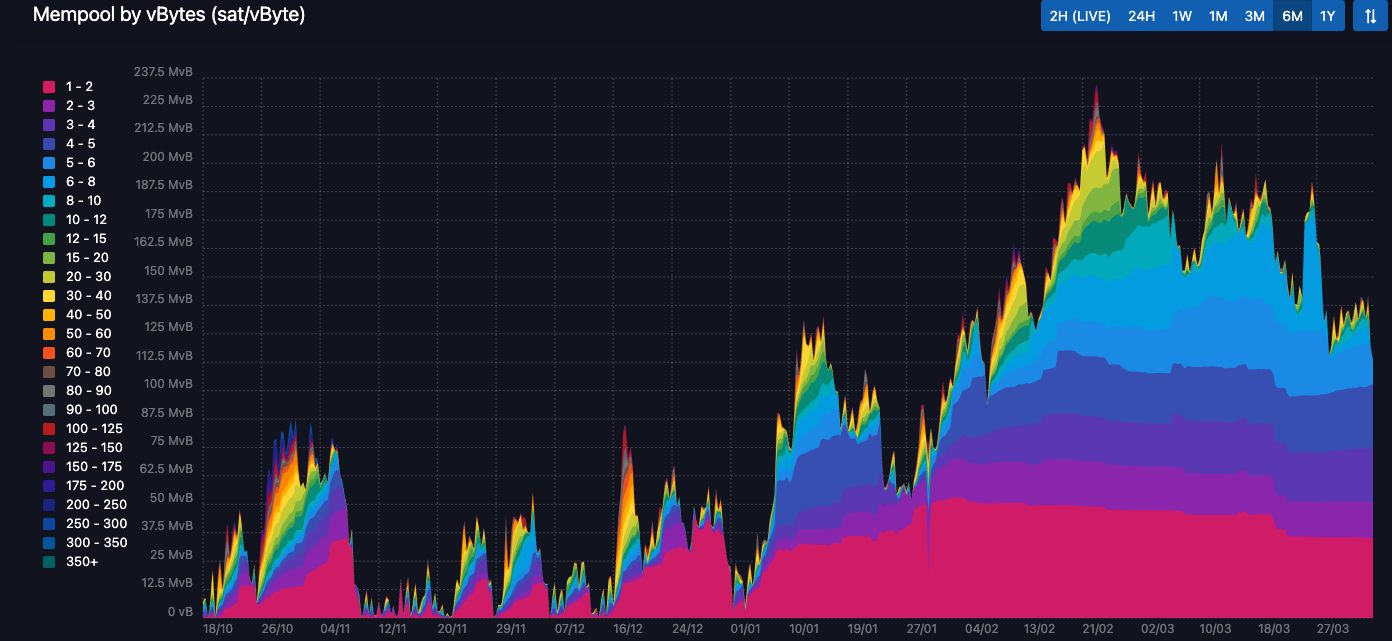
The size of the mempool continues trending lower but we are still at rather elevated levels. Transaction times and fees will be similar to what they have been over the last 2 weeks.
What's ahead for the week:
On the Macro side, the minutes from the latest FOMC meeting will be released this Wednesday afternoon. During the last meeting, some of the Fed's economic forecasts were revised sharply higher to reflect improving economic conditions. The minutes will provide insight into the thinking of the members of the committee. As a note, during the last meeting the U.S. GDP forecast was revised to grow by +6.5% vs. the +4.2% that was anticipated last December. Further, the Fed expects unemployment to drop to 4.5% by the end of the year and returning to pre-pandemic levels of 3.5% by 2023. The Fed also said that it expects to see near-term rates at near 0% through 2023. Jerome Powell, Chairman of the Fed, will also be speaking at an IMF panel on the state of the global economy on Thursday.
Switching gears back to Bitcoin, in a tweet earlier this week, Nick Core, a cryptocurrency trader, highlighted an interesting signal in an indicator called Buy/Sell Volume Imbalances. The Buy/Sell Volume Imbalances indicator tracks the volume of buy and sell transactions per bar (hourly, daily, weekly). The number of sells is subtracted from the number of buys and the difference is plotted in the indicator panel beneath each bar. Below is the recent snap shot for Bitcoin.
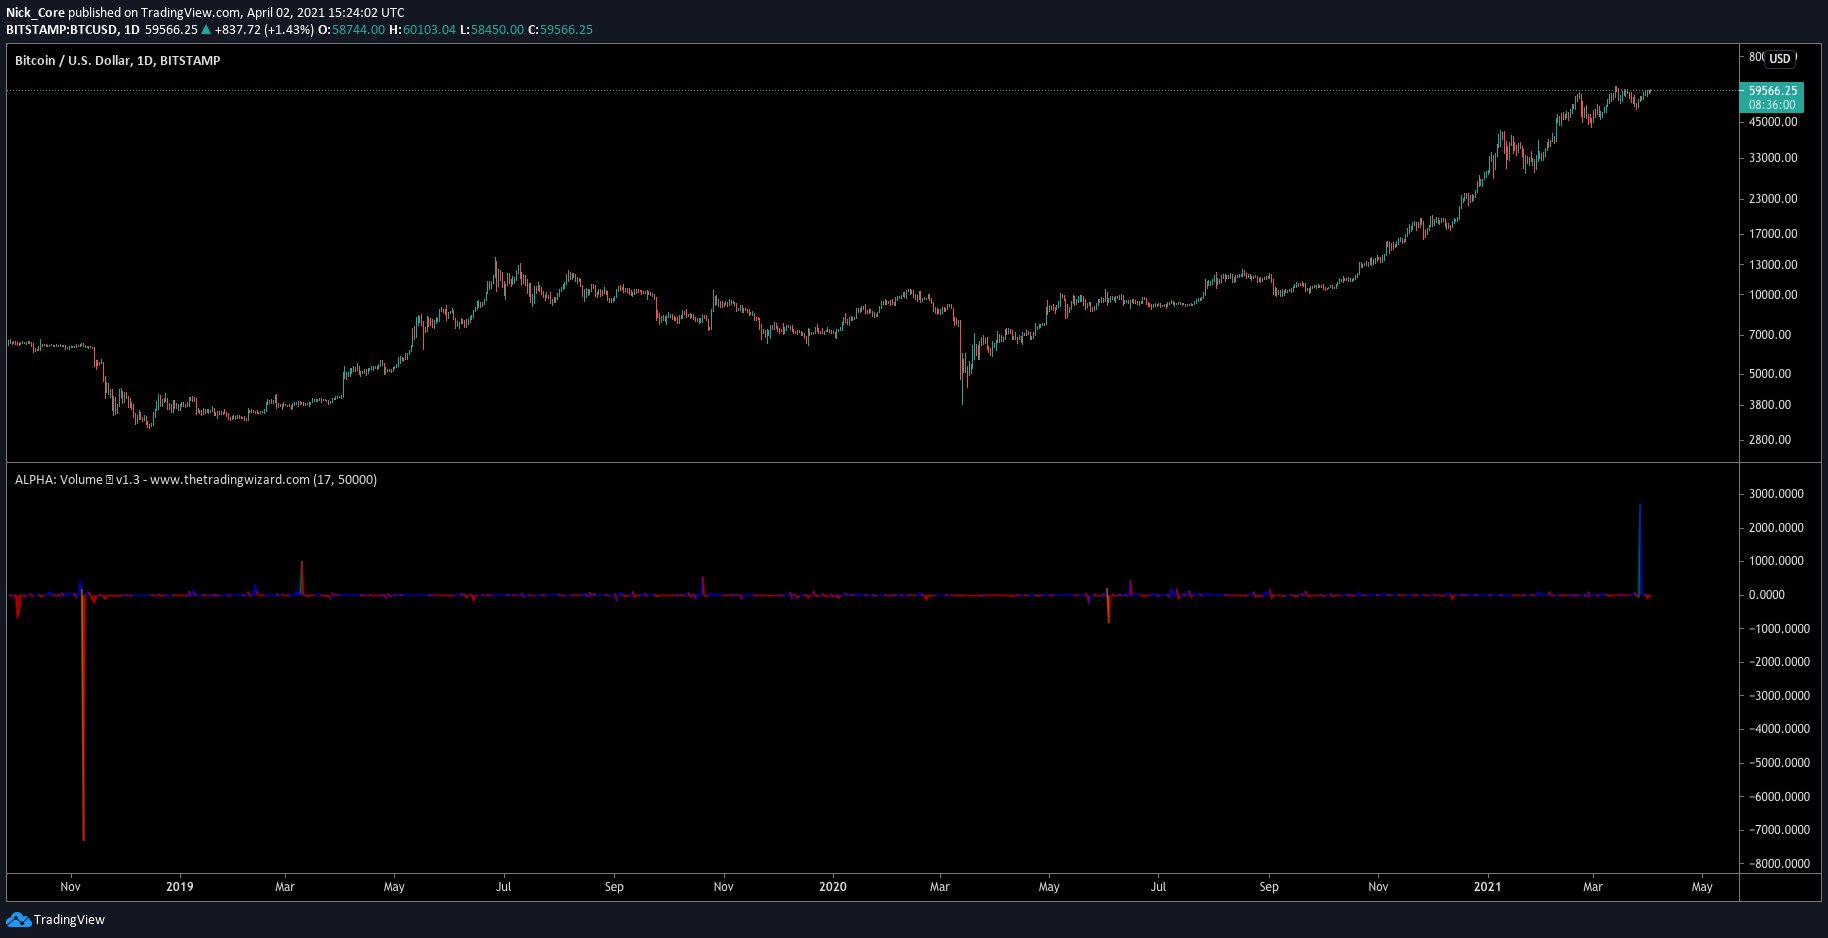
The blue bar signifies "more buys than sells", red bars signifies more sell orders than buys. The last time there was a bar this large was on the sell side, and it was right before the drop from $8k to ~$3k in November 2018. The recent blue spike shows a disproportionate amount of "buy" orders over "sell" orders. This shows that there is disproportionate demand to "buy" bitcoin on exchanges.
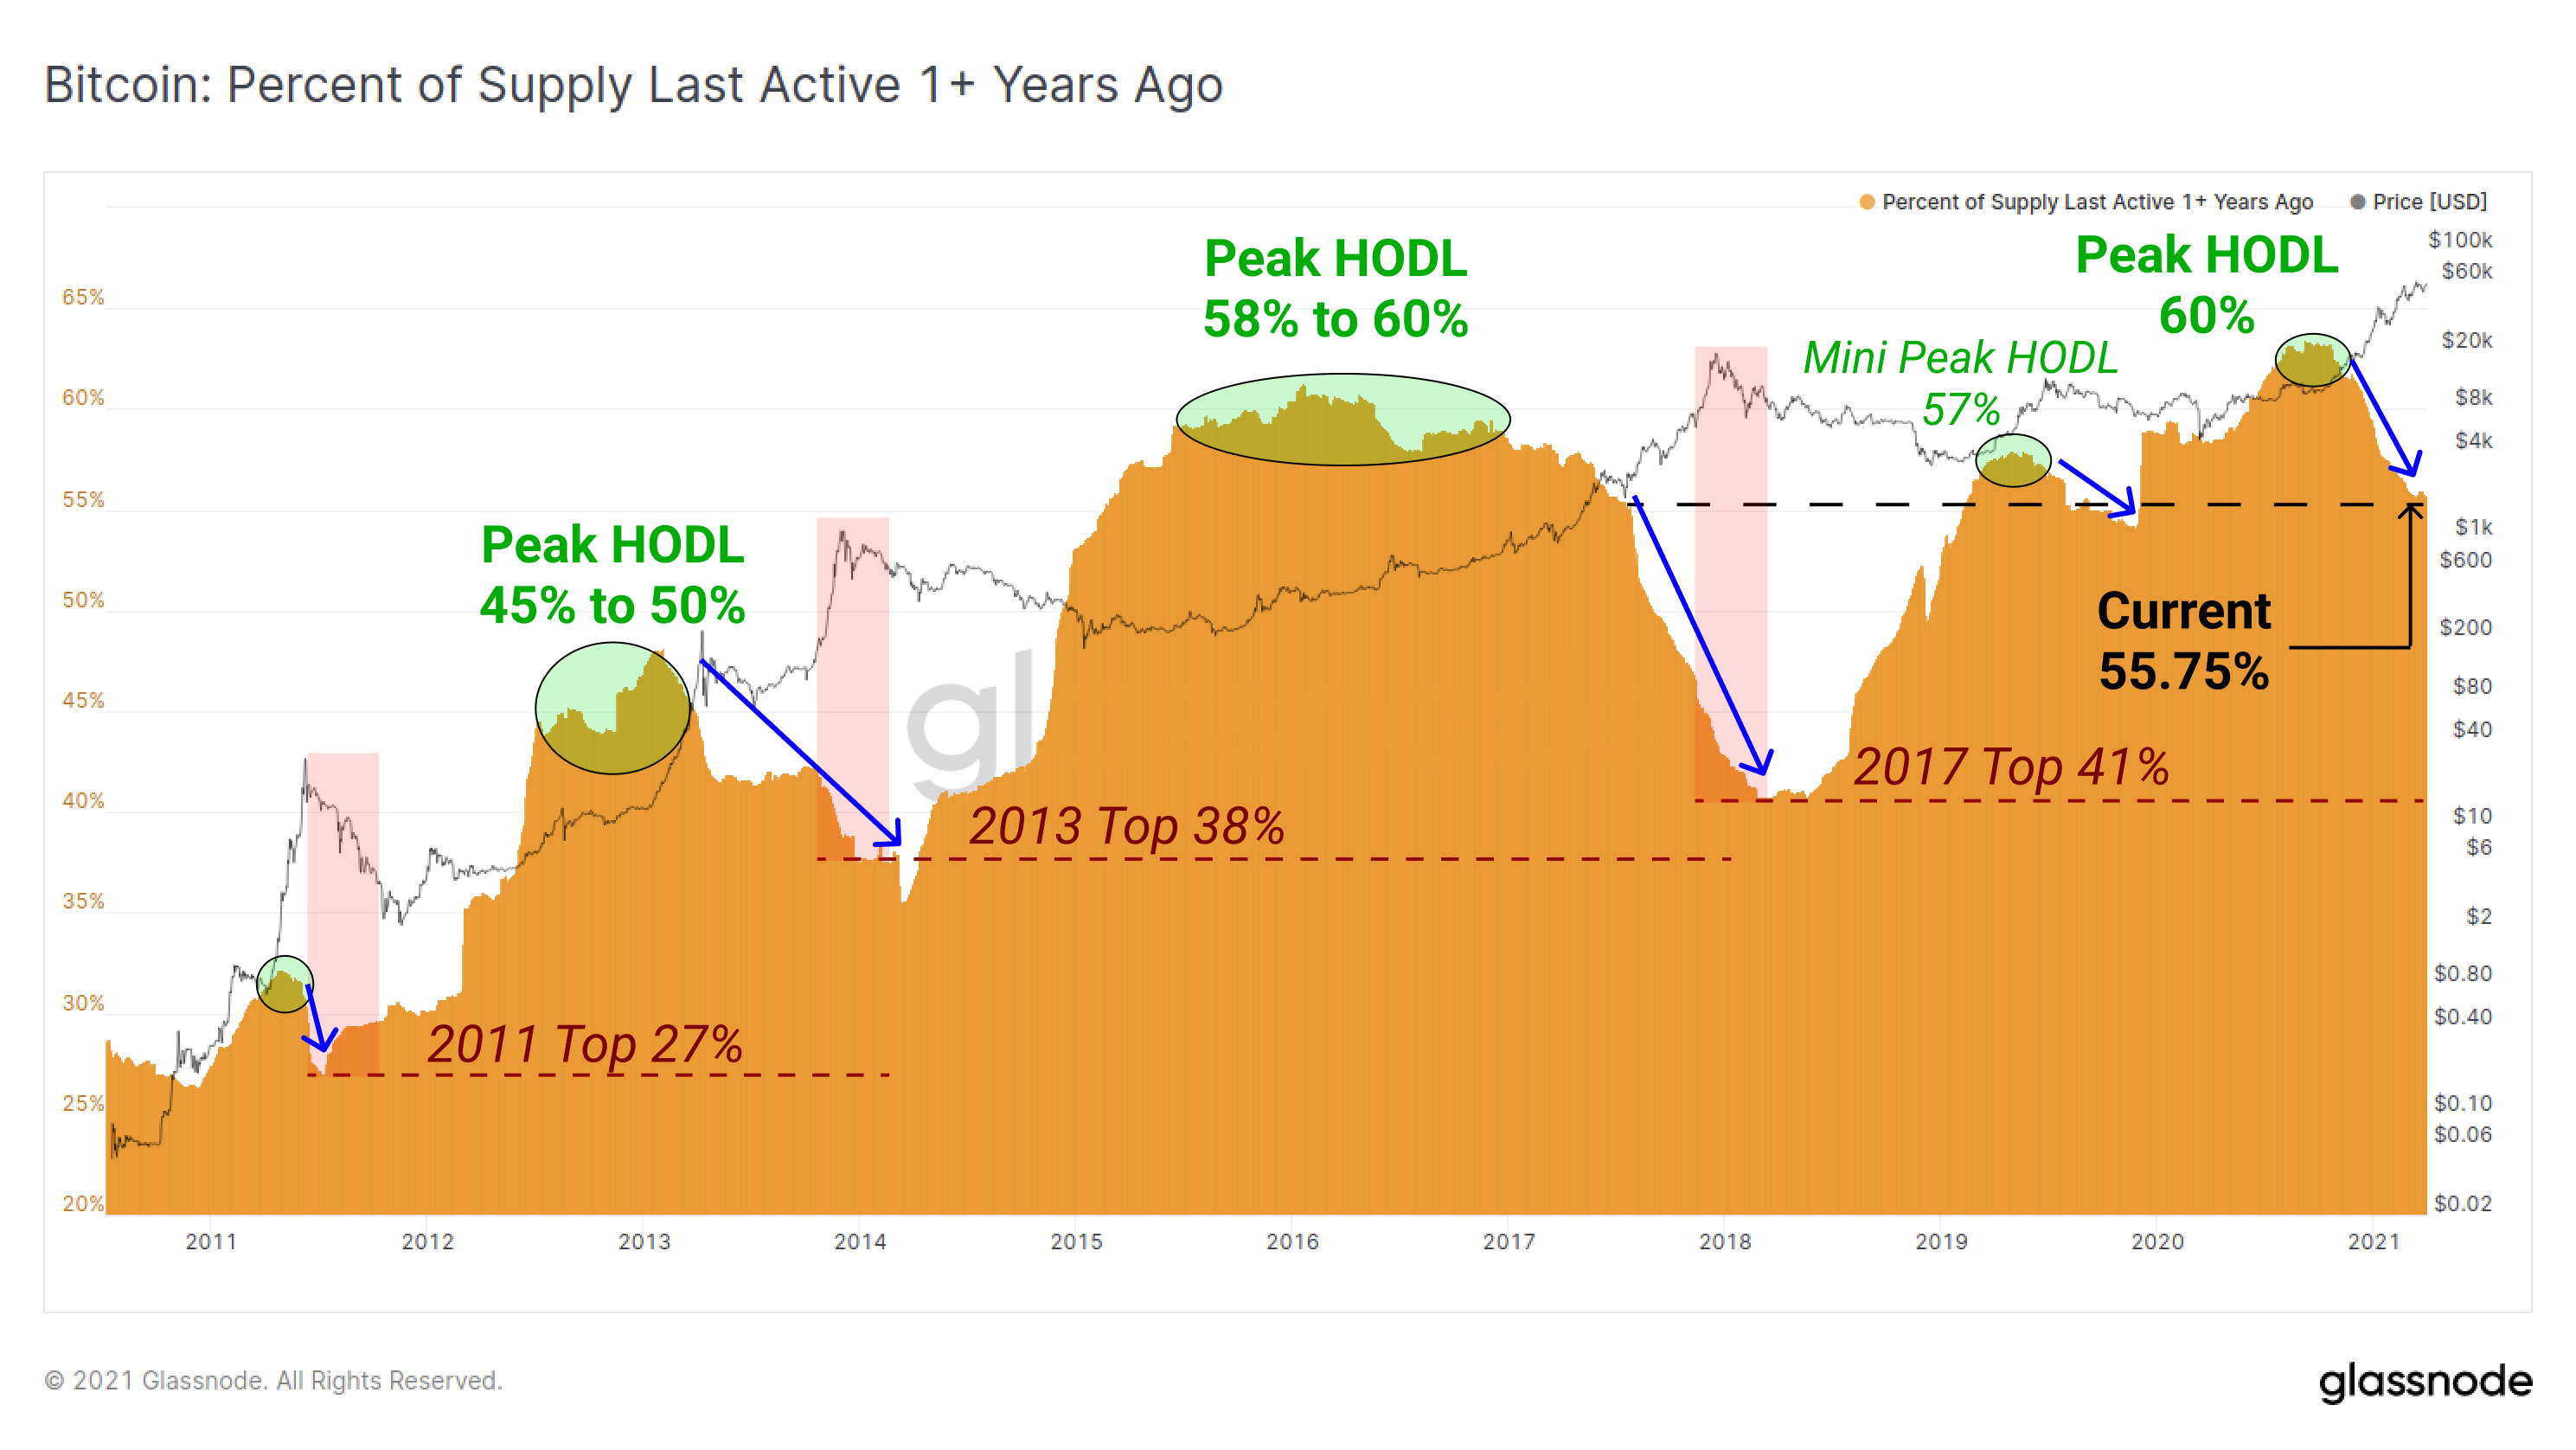
Glassnode, a prominent on-chain analytics firm, released a graph highlighting that large holders of Bitcoin typically sell into the early stages of rallies. On-chain data suggests that they (addresses last active over 1+ years ago), started selling as bitcoin crossed above $20k, and have continued selling into the current levels.
The main unknown for Bitcoin remains the proposed U.S. regulation of asset transactions. The commentary period for this proposed new regulation ended last week and regulatory updates could surface any time - and would likely significantly impact markets.
Big week coming up, as always, we'll keep you posted on any relevant news throughout the week right here and from our Twitter account @hodlwithLedn
Canadian Central Banking Updates:
Current Target Interest Rate: 0.00 - 0.25%
Current Overnight Money Market Rate: 0.23%
Source: https://www.bankofcanada.ca/rates/
U.S. Central Banking Updates:
Current Fed Interest Target Rate: 0.00 - 0.25%
Current Effective Federal Funds Rate: 0.09%
Source: https://apps.newyorkfed.org/markets/autorates/fed%20funds
***
This article is intended as general information only and is not to be relied upon as constituting legal, financial, investment, tax or other professional advice. A professional advisor should be consulted regarding your specific situation. The information contained in this publication has been obtained from sources that we believe to be reliable, however we do not represent or warrant that such information is accurate or complete. Past performance and forecasts are not a reliable indicator of future performance.
***