Ledn Blog
The Bitcoin Economic Calendar - Week of December 7th 2020
Big week of Economic Data ahead for the U.S. dollar - how could it impact markets? How to use Bitcoin to spot when a Central Bank is misrepresenting data. PayPal & Square are buying over 100% of all newly mined Bitcoin.
Not yet a Ledn client? Start earning 11.7% APY on your USDC and 6.5% APY on your Bitcoin today - click here to open your Ledn account!
Follow us in social media:
The Bitcoin Economic Calendar:
Week of Monday December 7th to Sunday December 13th.
Market Commentary:
Bitcoin: We started the week off with a bang taking us close to all-time highs and actually breaking them on Tuesday - however, that same day we went down fast to test the $18,000 levels. Those levels were met with heavy buying which lasted through the week. In some trading circles, the move that Bitcoin made from the $17k to $20k and now holding at around the mid $19k's is often referred to as an "accumulation" pattern. Coincidentally, Michael Saylor announced on Friday at end-of-day that his company, Microstrategy had purchased an additional $50 M worth of Bitcoin at an average price of $19,427 per Bitcoin, bringing their treasury holdings to 40,824 Bitcoin. This represents 0.194% of Bitcoin's total supply. Some of these institutional investors seem to have the conviction of feverish hodlers, averaging in - undeterred by the price-action. Additionally, a recent report by Pantera states that, based on data from ItBit, it is estimated that PayPal is now buying roughly 70% of the total newly mined Bitcoin supply. Combined with Square, both are purchasing over 100% of the total new mined bitcoin. Miners are often painted as the "natural sellers" of Bitcoin - and with their supply being accounted for on the buy-side, this can put upward pressure on order books and drive price higher.
All of this added up to Bitcoin closing the week at $19,375 for the week, finishing up 6.45%. We have a huge week of economic data out of the U.S. - this drives the dollar, which is, in turn, what is currently driving the markets. We'll talk about what we can expect this week in our "What's ahead" section today.
S&P 500: The dollar index fell by 1.19% this week, and the S&P index rose by 1.67%. The inverse relationship on these is so clear, that I thought it would be wise to show how dramatic it is on this chart. A picture sometimes can communicate more than 1,000 words. We wrote at length last issue about how the Fed is going to try to keep pushing the dollar lower. Investors see the falling dollar and are looking for places to shelter from inflation. Barring headwinds from end of year repositioning, we can expect investors to continue on this trend for the near future. We have a slew of economic data out of the U.S. this week, including inflation - markets will be looking to see if inflation remains low, which means the Fed needs to keep its foot on the gas. Last reading came in at 1.2%, and the Fed has vocally said they want to bring it to 2%+ in the near term.

Gold: Gold had a decent recovery week closing at $1,824 and gaining back 2.84% - still not fully back from the 4.43% it lost the week prior. Although it is comforting to see price action consistent with a falling dollar, it is important to have more context in mind - gold was trading at around $1,500 prior to March 12th and it rallied to $2,000. Which represents a 25% rally in a very large market. The price action we are seeing today perhaps reflects investors taking profit and rotating to more "risk-on" trades that have higher upside potential (inflation hedge + a call option on something else - like equities and/or Bitcoin). Historically, investors look at the ratio between the prices of Copper/Gold prices (industrial vs. precious metals) as a good indicator - and that index has been recently moving much higher. The narrative around the economic recovery in 2021 seems to be strengthening - and we may continue to see similar price action.
DeFi: Looking at the FTX DeFi index - we see that contrary to what we had expected last week, it outperformed ETH and BTC to the upside this week rallying 9.09% compared to BTC's 6.45% and ETH's 4.59% rise. This was likely due to strong catalysts that were announced throughout the week for the sector. For one, Visa announced that it will be working closely with stablecoin issuer Circle (USDC) to integrate into some of its services. Additionally, Fireblocks, a well known institutional custodian, announced on Monday that it would allow its clients to tap into DeFi. This likely drove speculation volume to the sector - which some investors may have been short, and caused a short-cover rally that pushed the sector as a whole to outperform the 2 main protocol assets. We will keep an eye going forward to see if the momentum can be maintained going forward.
How to use Bitcoin to spot when a Central Bank is misrepresenting data :
Not all Central Banks are created equal. While some try to be more transparent, there are others that deliberately try to fool its citizens and "game" the global financial systems using very old tricks. In the past, Central Banks were able to control the information available to the public, and therefore control local and foreign public opinion. With the advent of Bitcoin and publicly available P2P exchange data, Central Banks have been left with nowhere to hide.
Why would a Central Bank/Government lie about its exchange rate?
This is a great question. And the answer is = to help its "friends" at the government look good, and stay in power. It is commonly known that when a Central Bank gets "in bed" with the government very bad things happen. Let's explain how this works and why they would do this:
Let's assume a radical government takes over and forcefully starts enacting short-sighted economic policies to go against its political enemies and further its agenda. Well, these economic actors will look to protect their capital and sell any local currency possible to hold harder to seize assets such as U.S. dollars or Bitcoin in a foreign bank account. This pushes up inflation, which dwarfs investments in the local economy, and actually hurts citizens. Now, let's assume that the government doesn't want to "look bad" - what does it do? It decides to "set the price" for dollars. Preventing anyone else from selling them - effectively "controlling" the price.
What does this accomplish? Well - let's say that the new government wants to show the world all the good that its doing for its citizens. It decides to set the minimum wage at, 3,500 pesos and the exchange rate at 1 Peso = 1 USD. The problem comes when the everyone does not have access to dollars at 1 Peso per 1 Dollar - only the government's friends. In the "real market", the P2P market, the dollar will find its actual exchange rate - the rate at which real people within the local economy are willing to part ways with their dollars. Let's say that this rate is 100 pesos per 1 USD. Well, then suddenly your "amazing minimum wage" is no more than a mere $35/month. This is the real economic value of the salary. However, by setting the Official Exchange rate, the government can not only try to fool its citizens, but the international community. It can show artificially high wage numbers and economic activity - overstating its entire Gross Domestic Product.
Now - how to use Bitcoin to tell when a Central Bank is lying, and by how much!
Bitcoin has left the Central Bank emperors naked. Using publicly available data, everyone around the world can now determine when Central Banks are lying, and even determine the size of the lie factor.
To do this, we need 3 pieces of data:
1. A reference U.S. dollar price for Bitcoin (we can use Coinbase for this example)
2. The "Official U.S. Dollar exchange rate provided by a Central Bank (we will use Argentina in this example)
3. A reference local currency price for Bitcoin in a P2P market (we will use LocalBitcoin in Argentina for this example)
In the following example we will determine whether the Argentinian Central Bank is lying about its exchange rate and by how much:
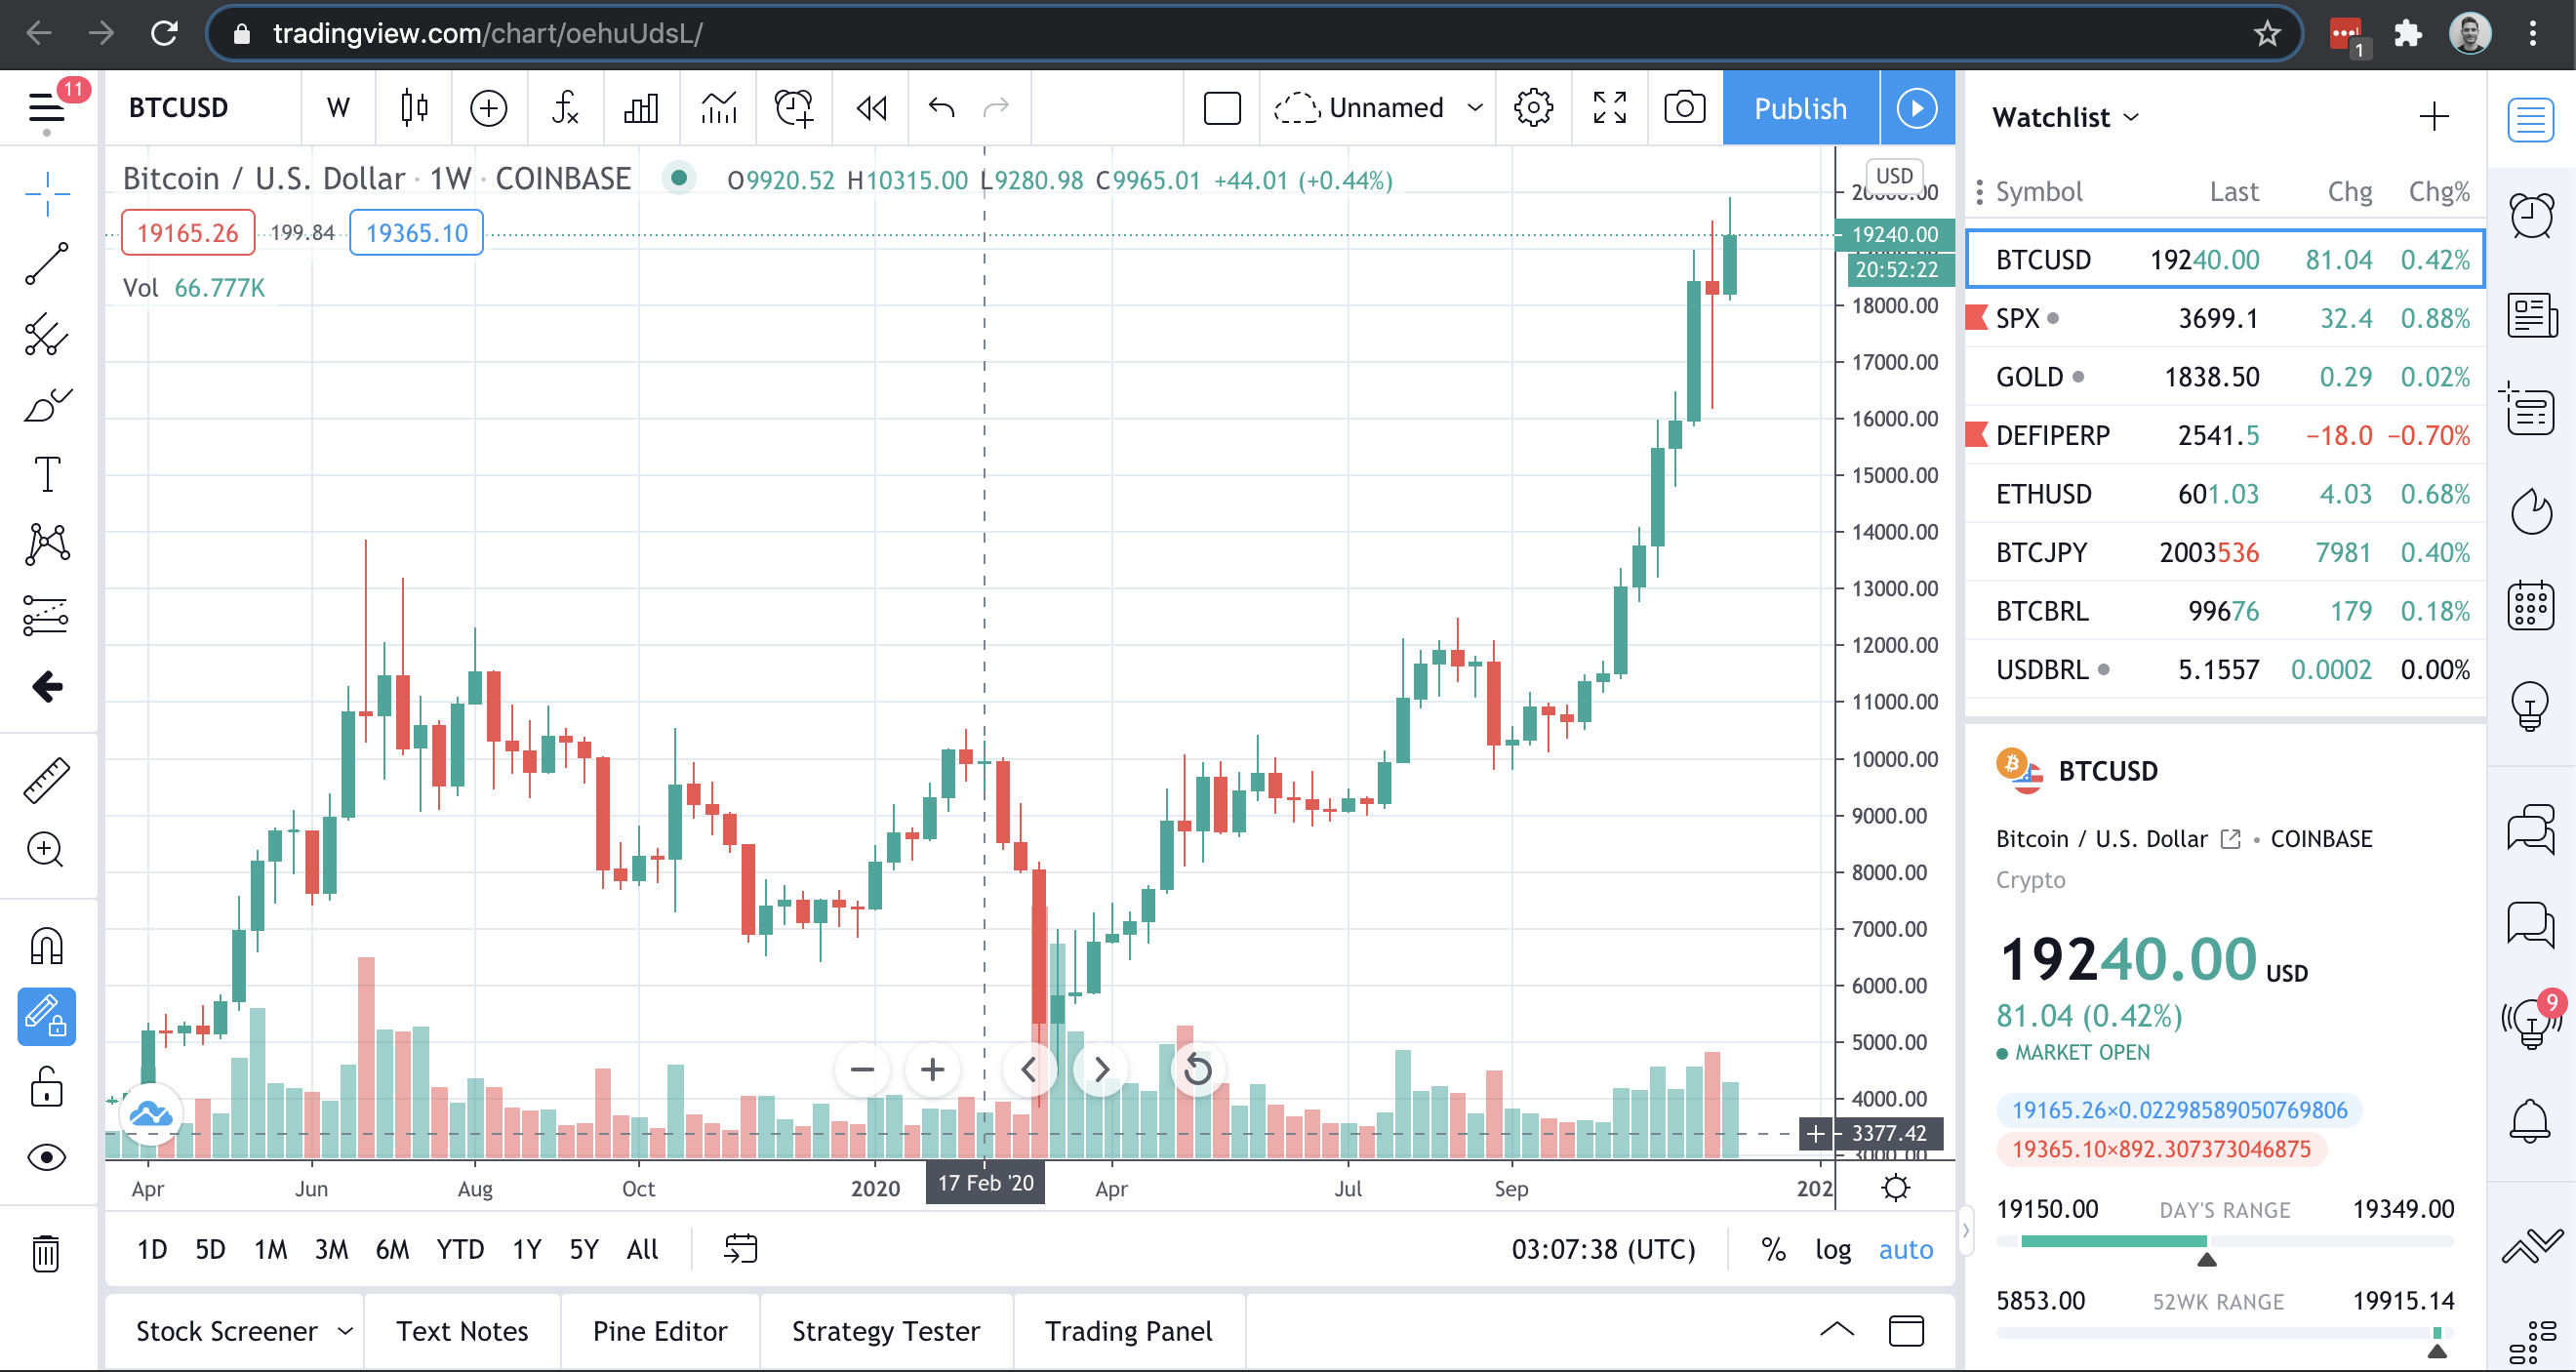
First, we determine the U.S. dollar price for Bitcoin. In our example, we will use the price of $19,240.00 from this past Saturday evening.

Second, we obtain the U.S. Dollar to Argentinian Peso exchange rate from the Argentinian Central Bank's website. According to the image below, the exchange rate that same Saturday evening was of 87.17 ARS/USD.

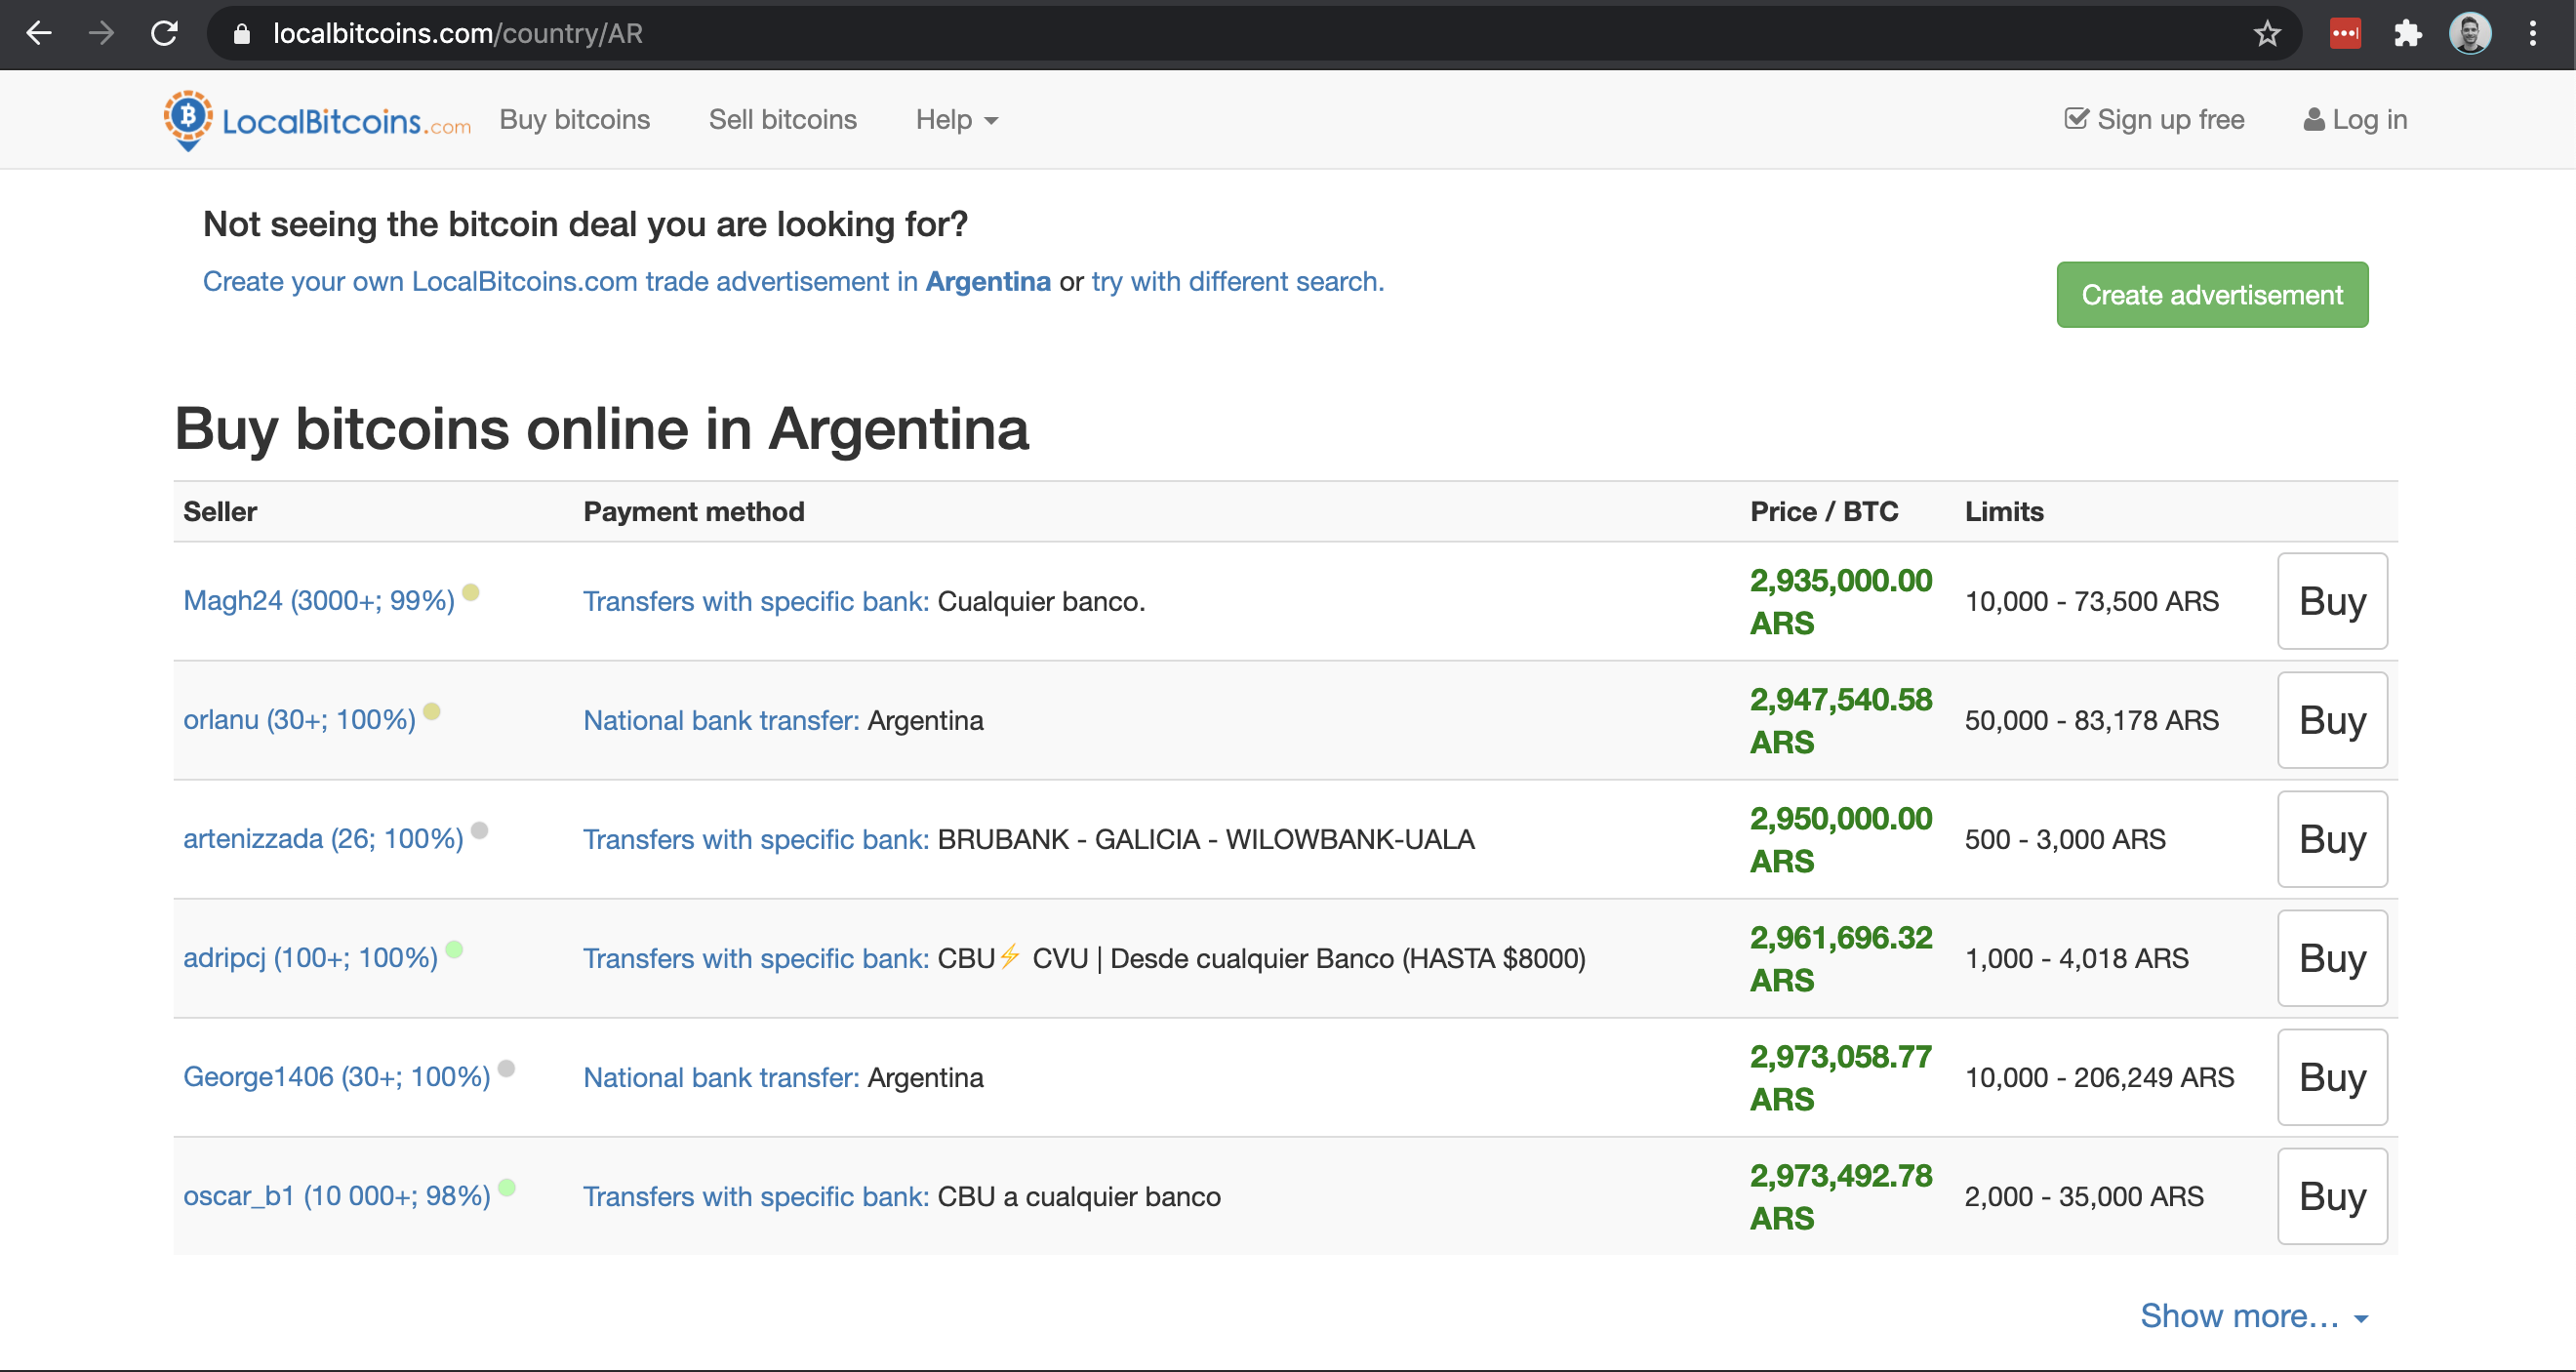
Lastly, we obtain the reference price for Bitcoin in Argentinian pesos from a P2P market at the same time. Based on the image below, the price to purchase Bitcoin in Argentinian pesos from LocalBitcoin at the time was of 2,935,500 ARS/BTC.

From these 3 pieces of data, we can determine the "real" exchange rate between USD and ARS by dividing the reference price from the P2P exchange in ARS/BTC and dividing that by the Bitcoin price in USD/BTC, to get the real USD/ARS exchange rate. Further, we can divide that exchange rate by the Central Bank's official rate to determine how much the Central Bank is misrepresenting the numbers.
Price for Bitcoin in U.S. Dollars: $19,240.00
USD/ARS Exchange Rate as per Argentinian Central Bank: 87.17 ARS/USD
Theoretical Price of Bitcoin according to the Argentinian Central Bank: 1,679,765 ARS/BTC
Actual Price of Bitcoin in ARS from P2P exchange: 2,935,500 ARS/BTC
"REAL" Exchange rate for USD/ARS: $152.3 ARS/USD (Bitcoin price in P2P exchange/Bitcoin Price in USD)
Argentinian Central Bank Misrepresentation Factor: 174.73%
From the data above, we can see that the Argentinian Central Bank is misrepresenting its actual exchange rate to its citizens, and the world. It is no surprise that inflation continues to skyrocket and that Bitcoin adoption advances at lightning speed in that market. With the tools provided, you too can determine whether your Central Bank is being honest. In the following issue, we will use Bitcoin all-time high prices to see inflationary pressures at play in different markets.
Difficulty Commentary
Not much has changed on the difficulty front since last week. We are still sitting at 19.16 TH and the next adjustment continues on track for next Sunday evening. Currently difficulty is signalling a relatively flat adjustment after signalling higher last week. We'll keep you informed of any relevant changes through our Social Media account.
What’s ahead for the week:
The week ahead is loaded with U.S. economic data every day of the week. While some are more relevant than others - market participants will be zeroing in to all of them for clues. On Monday we get Consumer Credit, on Tuesday we get Productivity & Unit Labour costs, on Wednesday we get Job Openings and Wholesale Inventories, Thursday is a huge day with Jobless Claims, Consumer Price Indexes (inflation reading), and the Federal Budget - then on Friday we close the week with the U.S. Consumer Sentiment reading. As we've mentioned here at length, the U.S. dollar is driving most markets - and the data coming out this week will be what the Fed is looking at to plan its next steps. Investors will be looking for signs that the Fed needs to keep its foot on the gas (low rates, aggressive lending plans) - which would equate to an inflation reading that is moderate. As a refresher, October inflation came in at 1.2%, and the Fed wants to get it over 2% - that's a LONG way to go.
On the Bitcoin and Crypto world - we had a lot of debate last week around the "Stable Act" - a proposed bill that would require stablecoin operators to register with bank charters - this seems unrelated to the regulation Brian Armstrong had eluded to in his Twitter thread 2 weeks ago. Although the new bill is in the early stages, we have seen a lot of activity out of the U.S. trying to regulate the space. We will continue to monitor any developments and discuss potential implications in the coming issues. As always, we'll keep you posted on any relevant news throughout the week from our Twitter account @hodlwithLedn.
Market-Moving Stats:
Bitcoin Hashrate and Network Difficulty:
Current Difficulty: 19.17 TH
Estimated Next Adjustment: 19.16 TH + 0.02%
Time to next Difficulty Update: 6 days (Sunday December 13th, 2020)
Difficulty All-time-high: 19.97 TH
Corporate Earnings
No relevant earnings for Bitcoin this week.
Canadian Central Banking Updates:
Current Target Interest Rate: 0.00 - 0.25%
Current Overnight Money Market Rate: 0.23%
Source: https://www.bankofcanada.ca/rates/
U.S. Central Banking Updates:
Current Fed Interest Target Rate: 0.00 - 0.25%
Current Effective Federal Funds Rate: 0.09%
Source: https://apps.newyorkfed.org/markets/autorates/fed%20funds